
Foreword
Why we built this, and where we have come from
For years, the safety profession has argued for a seat at the table. This survey is, in a quiet way, the receipt for that argument being won. Budgets are growing, process-safety money is protected, and boards are watching leading indicators, not just counting injuries after the fact. That is a genuine achievement, and the people who built it should be proud.
And yet, reading the responses back, we kept returning to one uncomfortable pattern: almost every strength we recorded at the top of the organisation grew fainter the closer it travelled to the people it was meant to protect. Recognition, psychological safety, leadership visibility, even the memory of a drill - strong in the boardroom, thin on the floor. We did not want to publish another report that celebrated the averages and looked past that slope.
So we built this edition differently. Every finding is drawn as its own picture, the perception gaps are treated as findings in their own right rather than smoothed away, and the whole thing ends not with conclusions but with a checklist a leadership team can score itself against. Our hope is simple: that you read it with your own frontline in mind, and measure the distance between what you believe is true and what they would say is true. Closing that distance is, to our mind, the entire job.
This research is part of how we try to give back to the community we serve. We spend our days inside these organisations; a survey like this lets us hold the whole industry up to the light at once, and hand what we learn back to everyone in it. If a single leadership team scores itself honestly against the checklist at the back and finds one gap worth closing, the effort will have paid for itself many times over.
To our clients, partners and the EHS community - from all of us at Sparrow.
- Team Sparrow
In this report
Contents
The method, in brief
Why this report earns a place on your desk
Nineteen findings, six domains, three cohorts and a checklist that turns the industry’s numbers into your organisation’s next move.
The paired-question method
Most EHS surveys report what respondents said. This one measures the distance between what two levels of the same organisation say about the same reality - what a Middle manager believes a worker would do, against what the worker says they’d actually do; how visible leadership rates itself, against how visible the frontline experiences it to be. Run across 1000+ respondents, that method turns nineteen data points into one repeatable story.
What you’ll take away
Three things a single slide can’t deliver: a shared vocabulary for the gap (“the gradient problem”); hard evidence of where it is widest - recognition falls 43 points between Middle and Entry level, psychological safety falls 40, believed hazard-reporting overstates actual reporting by 31 points; and a 15-item readiness checklist, each item mapped to the finding that motivates it, so the report closes as a self-audit rather than a read-once briefing.
Why the findings hold up
Every major claim is cross-checked at two organisational levels before it is presented as a finding - the same design that surfaced, for instance, that 92% of Entry-level staff feel empowered to stop unsafe work while only 42% feel psychologically safe reporting one in the first place. A strength and its shadow, from the same cohort, on the same page.
The effort behind it
1300+ manhours went into fieldwork, cross-tabulation and validation across the three cohorts, with reviewers checking every paired finding against source data before inclusion. Only nineteen of the questions surveyed met the bar for a place in this report.
The short version
Executive summary
The EHS function in India is better funded, better instrumented and more visible in the boardroom than it has been at any point in recent memory. 86% of Senior leaders report growing EHS spend, 81% protect a dedicated budget line for process safety, and 97% track leading indicators alongside lagging ones. By the standards the profession has historically been measured against, these are remarkable numbers.
Yet the survey also shows, with unusual clarity, where the next five years of work sit. Almost every strength recorded at the top of the organisation weakens as it travels toward the people it is meant to protect. Recognition programmes, psychological safety, emergency drills and leadership visibility all register strongly with management and far more faintly at Entry level. At the same time, the digital ambitions of the function are running well ahead of its digital maturity, and the talent pipeline is quietly drifting away from the credentials and institutions the profession itself hires from. The nineteen findings describe both halves of that picture: a function that has won the argument for resources, and has not yet closed the loop with its own frontline.
Six messages for leadership
What a board should take from the 2025–26 cycle
Investment has turned a corner.
EHS spend is growing for 86% of Senior leaders and 56% of Middle managers, and 81% of Senior respondents report a ring-fenced budget line for process hazard analyses, HAZOP studies and pressure relief inspections. The function is no longer argued for as a cost to be tolerated. The question has moved from whether to fund safety to what the new money should buy - and that is a better class of problem.
The operational core is sound.
92% of organisations run some form of Management of Change process, 74% keep at least 80% of safety-critical equipment within calibration, and the lagging-only mindset has all but disappeared at the top. The quiet disciplines that rarely make headlines are, on this evidence, doing their job. This foundation is what makes the more ambitious moves in this report affordable.
Empowerment has reached the frontline; confidence in the system has not.
92% of Entry-level staff feel able to stop unsafe work, the single strongest culture number in the survey. Yet the same cohort reports only 42% psychological safety when reporting problems, rates the organisation’s readiness lower than every other group, and trusts its own readiness more than the system around it.
“The frontline believes in itself more than it believes in the structure behind it.”
Every management signal fades on the way down.
Formal recognition falls from about 60% at Middle to 17% at Entry. Drills within twelve months fall from 77% to 50%. Leadership visibility falls from a self-rated 2.47 to an experienced 1.75. Middle managers believe 56% of workers would report a hazard at once; workers themselves say 25%. PIC. 1 shows the pattern in one picture. This is the report’s central finding, and most of the readiness checklist follows from it.
Digital ambition is running ahead of digital maturity.
78% of Senior leaders call their decisions data-driven and 72% of Middle managers are confident with dashboards, but active, at-scale use of AI or predictive tools sits between 3% and 17% across every level. The blocker is not belief. Budget is the top barrier for both Senior (53%) and Middle (55%) respondents, which makes this a capital allocation decision rather than a change management one.
The talent pipeline is quietly drifting off course.
Career sentiment clusters at neutral rather than negative, which builds no pull. Senior leaders hire mainly from engineering colleges and Middle managers prefer safety institutes, yet fewer than 5% of Entry-level respondents are pursuing NEBOSH or RLI, a third are pursuing nothing at all, and the largest group is investing in general management degrees. The credentials the profession values and the credentials its next generation is building are moving apart.
PIC. 1 · The fading signal, in one picture
Seven management strengths, and how much of each one survives the trip to the frontline
Each line begins at the value reported by the level that runs the programme and ends at the value experienced by Entry-level staff. Nothing here suggests management is misreporting - the more likely reading is that programmes real at the level that runs them are simply invisible at the level they are meant to serve.
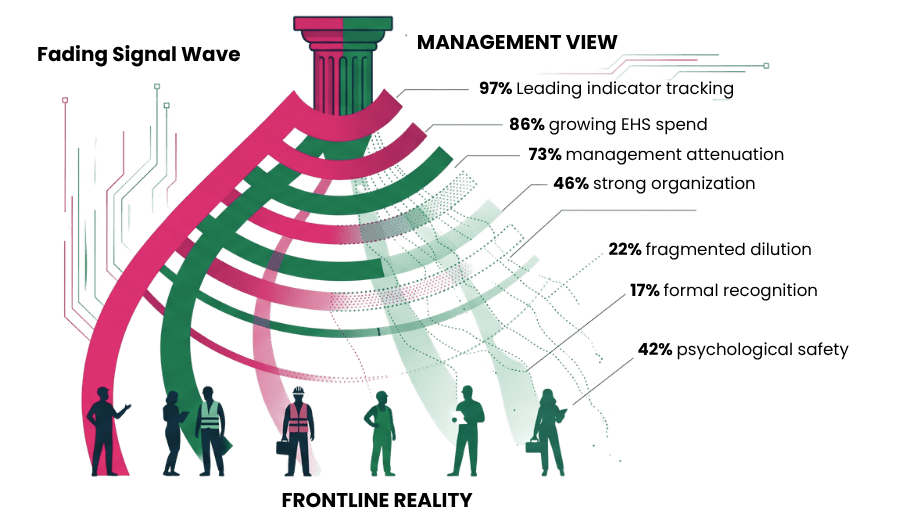
Source: Sparrow RMS EHS Research Survey, 2025–26 cycle. Metrics are normalised to a percentage scale for direct visual comparison. Original scale anchors: leadership visibility (1–3 scale), confidence in organisation (1–10 scale). Scores converted via score ÷ maximum.
The rest of this report works through the evidence chapter by chapter, and closes with a readiness checklist: fifteen statements a leadership team can score itself against, each mapped to the finding it draws on, so the report ends as a self-audit rather than a reading exercise.
Reading across the chapters
Four threads that run through the findings
The gradient problem
The survey’s most consistent pattern is not any single number but a slope. Ask a question near the top of the organisation and the answer is healthy; ask the same question at Entry level and it decays, usually by half. Recognition, reporting culture, leadership visibility, drill awareness and organisational confidence all follow the same line.
Any initiative that does not name a frontline-visible outcome should be treated as unfinished.
Money is moving faster than tools
Budgets are up, process safety money is protected, and the appetite for data-led decision making is established at both senior and middle layers. Yet the tools this appetite needs remain scarce: AI and predictive analytics sit at single-digit to low-teen adoption everywhere, and both cohorts name budget as the top barrier. The paradox usually means digital investment is competing inside an operational envelope rather than being planned as capital.
Moving it may matter more than increasing it.
Systems exist; consistency is the frontier
Almost no one lacks a Management of Change process, but fewer than half run one that is fully formal and mandatory. CAPA works partially for two-thirds of the frontline but fully for only 17%. Drills happen but do not reach everyone. The survey describes a profession past the era of missing systems and into the era of uneven ones.
The remaining variance is no longer a design problem; it is an enforcement and follow-through problem - cheaper to fix and harder to sustain.
The pipeline paradox
The people most convinced that specialised safety education matters are the ones closest to the shop floor: Middle managers prefer safety institutes over engineering colleges, reversing their seniors’ pattern. But the incoming generation is investing in MBAs and international certificates, not the safety credentials their future managers value, and career sentiment is too flat to pull them back.
Left alone, the gap widens exactly when today’s Middle cohort steps up into Senior roles.
Chapter one
Career and talent
The profession is not driving its young people away; it is failing to give them a reason to stay, and it is hiring from places they are not going. Sentiment sits at neutral rather than negative, while the credentials being built at Entry level bear little resemblance to the ones the hiring managers above them prefer.
EHS career satisfaction and recommendation
We asked Middle and Entry-level respondents how satisfied they are with EHS as a career, and whether they would recommend it to a younger colleague. Both groups cluster heavily around a neutral response, at roughly 37 to 42% on each question. The clearest difference sits at the negative end: the share of Entry-level respondents answering no outright is close to three times that of Middle managers.
Neutral response band - both cohorts, both questions
Middle and Entry level alike land in this band on career satisfaction and on whether they would recommend EHS to a younger colleague.
The negative end - outright “no”
baseline ×1
≈×3
The share of Entry-level respondents answering no outright is close to three times the Middle-manager rate. Shown as a ratio - the survey reports the multiple, not a percentage.
What the data suggests
EHS is not seen as a poor career - the trouble is that very few describe it as a strong one. Sentiment stays flat and neutral at every level, and that flatness is arguably a larger long-term risk to the pipeline than the smaller pocket of outright dissatisfaction at Entry level.
Hiring preferences by seniority
Senior leaders overwhelmingly favour engineering colleges with a safety specialisation (54%), followed by the Regional Labour Institute and other safety institutions (22%). Middle managers show a different pattern, with RLI and safety institutions (31%) narrowly edging out engineering colleges (28%). Entry-level staff, asked what they are personally pursuing, gravitate toward general management degrees (42%) and international certifications such as IEMA (33%), with a full third pursuing nothing at all. Fewer than 5% pursue NEBOSH or RLI - the exact credentials Middle managers value most.
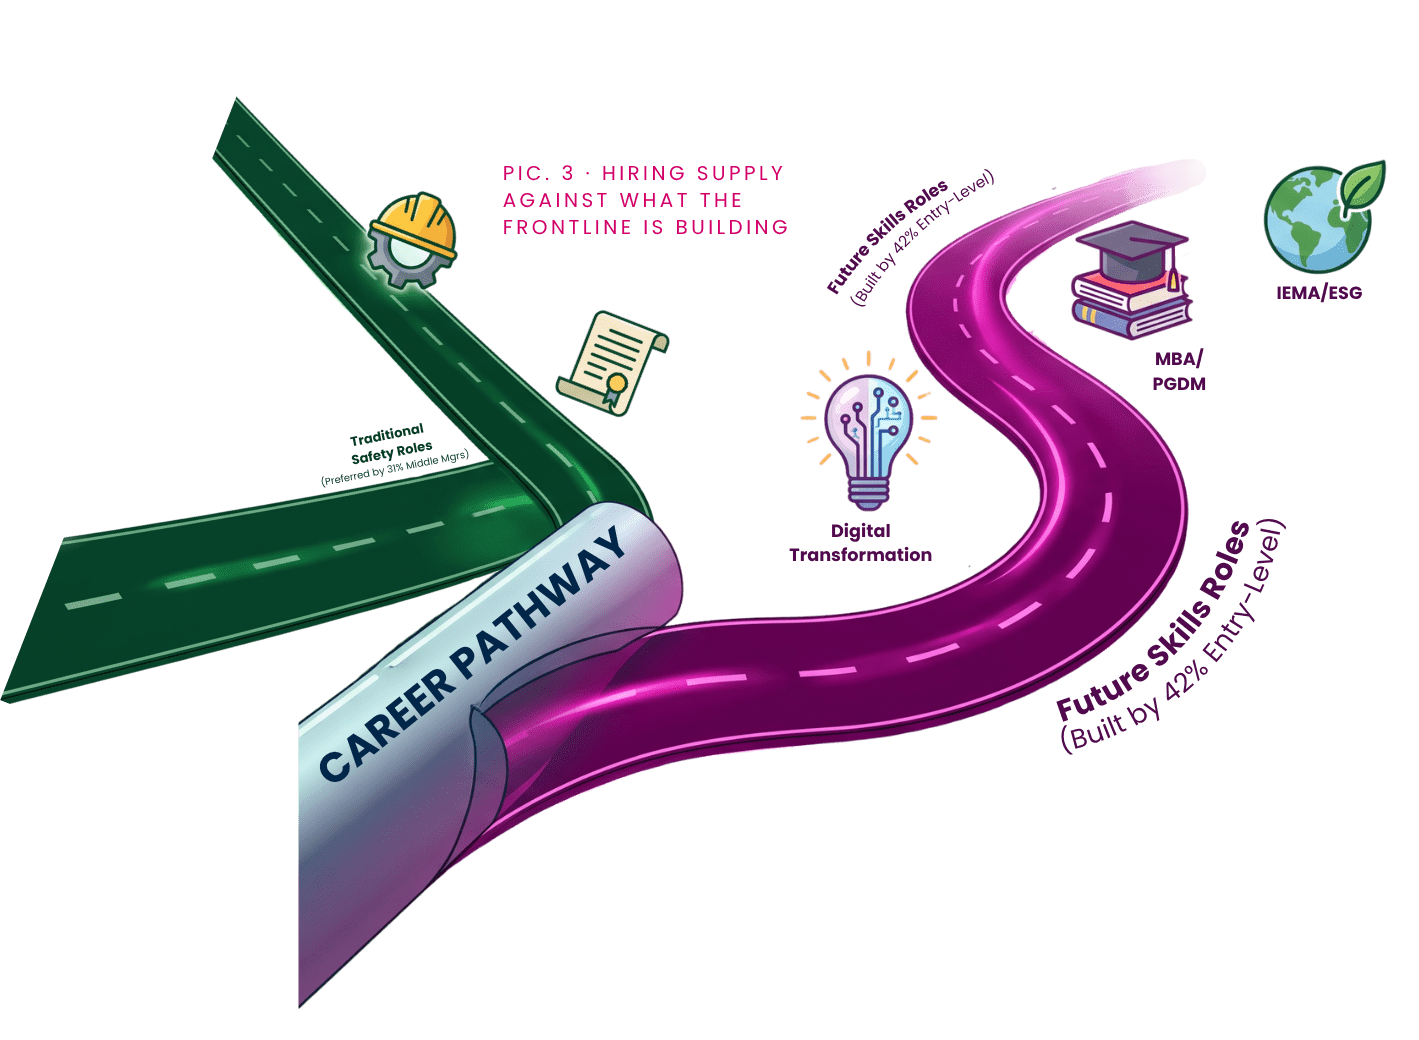
Senior leaders hire from
Middle managers prefer
The seniors’ order, reversed.
Entry level is building
What the data suggests
The closer a role sits to the shop floor, the more the value of specialised safety education is recognised. But what the Entry-level pipeline is actually building pulls toward general management and international certifications rather than the safety institutes their future managers prefer. There is also a noticeable difference in the attributes that entry-level respondents prefer in new joiners.
The channel the profession hires through and the credentials the next generation is investing in are drifting apart.
Chapter two
Safety culture
This chapter holds the survey’s best and most troubling numbers at once. Stop-work empowerment has genuinely reached the frontline, and almost everything else weakens on the way there: recognition, psychological safety, reporting intent, leadership visibility and confidence in the organisation all read materially lower at Entry level than the layers above believe them to be.
Stop-work authority and empowerment
A frontline worker’s willingness to halt an unsafe operation, without fear of consequences, is one of the clearest signs of a healthy safety culture. 72% of Middle managers and 92% of Entry-level staff said they feel personally empowered to stop work at once when they see an imminent risk.
Feel empowered to halt operations
What the data suggests
This is one of the strongest and most reassuring numbers to come out of the survey, and it deserves to be led with rather than buried.
Stop-work culture has reached the frontline in a real way.
Recognition programmes: strong at the top, thin at the frontline
Senior leaders (53%) and Middle managers (about 60%) report solid formal programmes to recognise and reward safety excellence. Entry-level tells a different story: only 17% report a formal programme, and most describe safety as something simply expected of them rather than rewarded.
What the data suggests
Recognition programmes clearly exist, both on paper and in the experience of leadership. The disconnect is that they do not appear to reach, or to register with, the people doing the frontline work the programmes are meant to reward.
Frontline reporting culture: belief against reality
Senior leaders (73%) and Middle managers (82%) report strong psychological safety. Entry-level drops to 42%, with half sitting at neither agree nor disagree. On action, Middle managers believe 56% of workers would report a hazard immediately; the Entry-level figure for the same behaviour is 25%, and 42% say they would stay quiet unless the issue affected them personally. This is the widest perception gap found anywhere in the survey.
Psychological safety
Would report a hazard immediately
31-point belief gap - the widest in the survey.
What the data suggests
The reporting culture Middle management believes exists is meaningfully more optimistic than the one frontline workers describe. The gap begins earlier, in a difference of psychological safety already wide before anyone has anything to report.
Leadership visibility: self-rating against experience
Senior leaders and Middle managers both rate their own visibility during safety walks and incident reviews at about 2.47 on a scale of 3. Entry-level staff, rating what they actually experience, put it at 1.75.
Rated on a 1–3 Likert scale, where 1 = rarely visible and 3 = consistently visible.
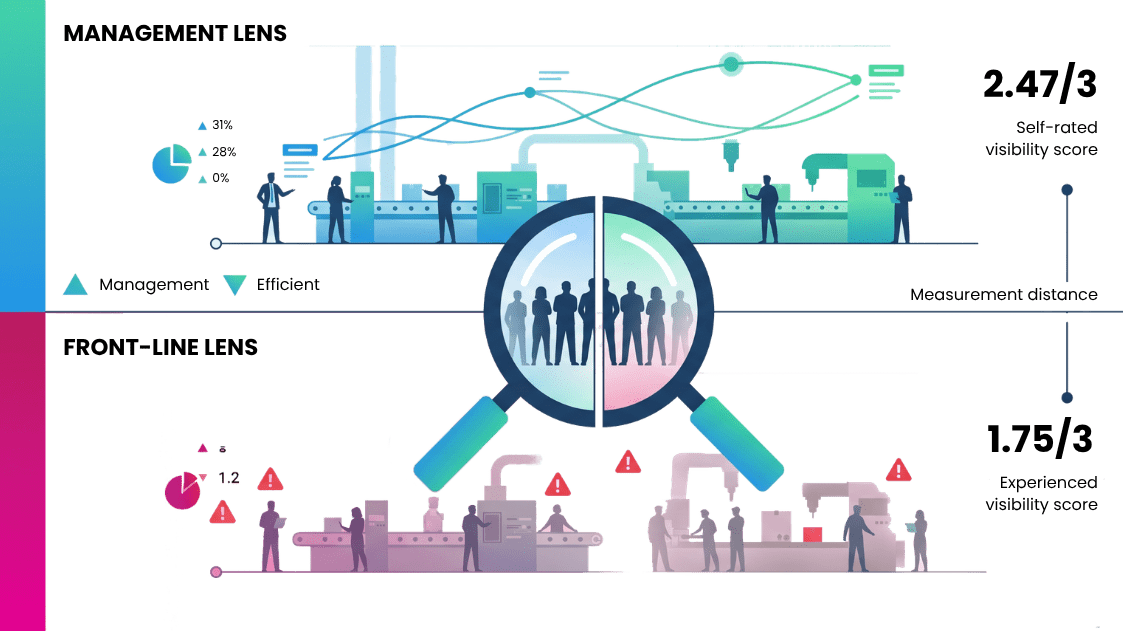
Management lens
Self-rated visibility score
Frontline lens
Experienced visibility score
What the data suggests
There is a real, measurable gap of about 0.7 of a point between how visible leadership believes it is and how visible it feels on the ground.
“Making leadership presence something the frontline can see and name may do more for safety culture than any new policy.”
Risk-readiness perception gap: organisation vs self
Senior leaders and Middle managers rate the organisation’s overall risk readiness highest, at 7.44 and 7.34. Entry-level staff rate the organisation lowest, at 6.67, yet rate their own personal readiness the highest of all three groups, at 7.33.
Measured on a 1–10 scale, where 1 = lowest readiness and 10 = highest readiness.
Source: Sparrow RMS EHS Research Survey, 2025–26 cycle. Mean score on a 10-point scale. The hatched bar marks Entry-level’s rating of their own readiness.
What the data suggests
Entry-level staff trust themselves more than they trust the system around them. That inversion is worth examining closely: frontline confidence, which is genuinely high, has not translated into confidence in the organisational support meant to stand behind it. Where senior and middle staff see the organisation as the stronger of the two, the frontline sees itself carrying more of the weight.
Chapter three
EHS budget and investment
The clearest good news in the survey. Spend is rising at both levels that control it, and process safety money has largely broken free of the general maintenance budget. The open question is not whether the money is there but whether it is being planned in a way that can fund the digital programme Chapter 5 shows the organisation wants.
EHS investment trend
We asked how EHS-related spend - training, audits, tools and consultants - has changed over the past two to three years. 86% of Senior leaders and 56% of Middle managers report growth, whether moderate or significant.
What the data suggests
EHS is no longer being treated as a cost centre to be trimmed. The gap between the senior and middle figures is worth noting: leadership sees the investment more clearly than the managers who often administer it.
Process safety budget ring-fencing
We asked whether organisations protect a dedicated, ring-fenced budget line for process hazard analyses, HAZOP studies and pressure relief inspections, kept separate from general maintenance spend. 81% of Senior leaders and 72% of Middle managers agreed.
What the data suggests
Process safety funding has largely broken free of the general maintenance budget.
A dedicated line for this work, once rare, is now closer to the norm than the exception.
Chapter four
Process safety and operational discipline
Where the discipline shows. Management of Change is near-universal, equipment calibration is largely current, and drills run on a healthy cadence at management level. The pattern to watch is Chapter 2’s again: the further a control sits from the people it protects, the healthier it looks, with drills and CAPA both reading weakest exactly where they matter most.
Management of Change process existence
We asked Senior leaders how formal their Management of Change process is for capital projects that modify pressure systems or chemical inventories. 92% report that some form of MOC process exists; 46% describe it as fully formal and mandatory, with a documented risk assessment.
What the data suggests
Management of Change, as a concept, has been institutionalised almost everywhere.
The open question is no longer whether a process exists but how consistently it is enforced.
Safety-critical equipment calibration currency
We asked what share of safety-critical equipment - fire suppression, gas detectors, pressure relief valves - is currently within its inspection and calibration validity. 74% report coverage of 80% or higher, and 59% track this on live dashboards running above 95%.
report 80%+ of safety-critical equipment within calibration validity
track calibration on live dashboards running above 95%
What the data suggests
Equipment readiness is in good shape across most organisations - one of the cases where quiet, routine discipline is working exactly as intended. It rarely draws attention because it rarely fails, but it is precisely this unglamorous consistency that keeps the more visible parts of a safety programme standing.
Emergency drill recency
We asked all three levels when their facility last ran a full, scenario-based emergency drill. Senior leaders (86%) and Middle managers (77%) report one within the last 12 months. The Entry-level figure drops to 50%.
Drill within the last 12 months
What the data suggests
Drills are clearly happening at a healthy cadence at management level. The gap is that the activity, and whatever it produces, is not reaching or not visible to the frontline staff who would actually be on the ground during an emergency.
CAPA effectiveness
We asked Entry-level staff to rate how effective their corrective and preventive action (CAPA) system is at stopping repeat incidents. Two-thirds (67%) rate it at least partially effective. Only 17% call it fully effective, and roughly half report that similar incidents still recur.
rate CAPA at least partially effective
closed-loop effectiveness - call it fully effective
recurring-incident leakage - similar incidents still recur
What the data suggests
CAPA is functioning rather than failing, but the phrase “partially effective” is carrying a great deal of weight in that headline number. The real improvement is in the distance between partially and fully effective. A system that reduces repeat incidents without closing them out entirely is worth building on, not replacing.
Chapter five
Digital transformation and AI
Willing minds, missing tools. Comfort with data has crossed a real threshold in the senior and middle layers, and where automation has landed it is already paying off. But at-scale use of AI and predictive tools remains rare everywhere, and both cohorts point at the same blocker: budget, not belief.
Data-driven decision making and confidence
78% of Senior leaders describe their EHS decisions as at least somewhat data-driven, and 72% of Middle managers feel confident or very confident interpreting dashboards.
What the data suggests
Comfort with data has crossed a real threshold in the middle and senior layers. The appetite to lean on data more heavily is largely there; what holds it back is not willingness but the quality and availability of the tools put in front of people.
Leading and lagging indicator tracking
of Senior leaders now track leading indicators - near-miss trends, unsafe acts, inspection scores - alongside lagging ones, to at least some degree.
The lagging-only mindset has essentially disappeared at the top of the organisation. The shift in what leaders choose to watch is close to complete; the shift in how well they watch it is still under way.
AI and digital tools reducing repetitive work
We asked Middle managers whether AI or automation has meaningfully reduced repetitive administrative work. 59% report at least some reduction, whether modest or significant.
What the data suggests
Early adoption of AI and digital tools is already paying off in small but real ways - a useful counterpoint to the maturity gap in the next finding.
AI and predictive tool maturity
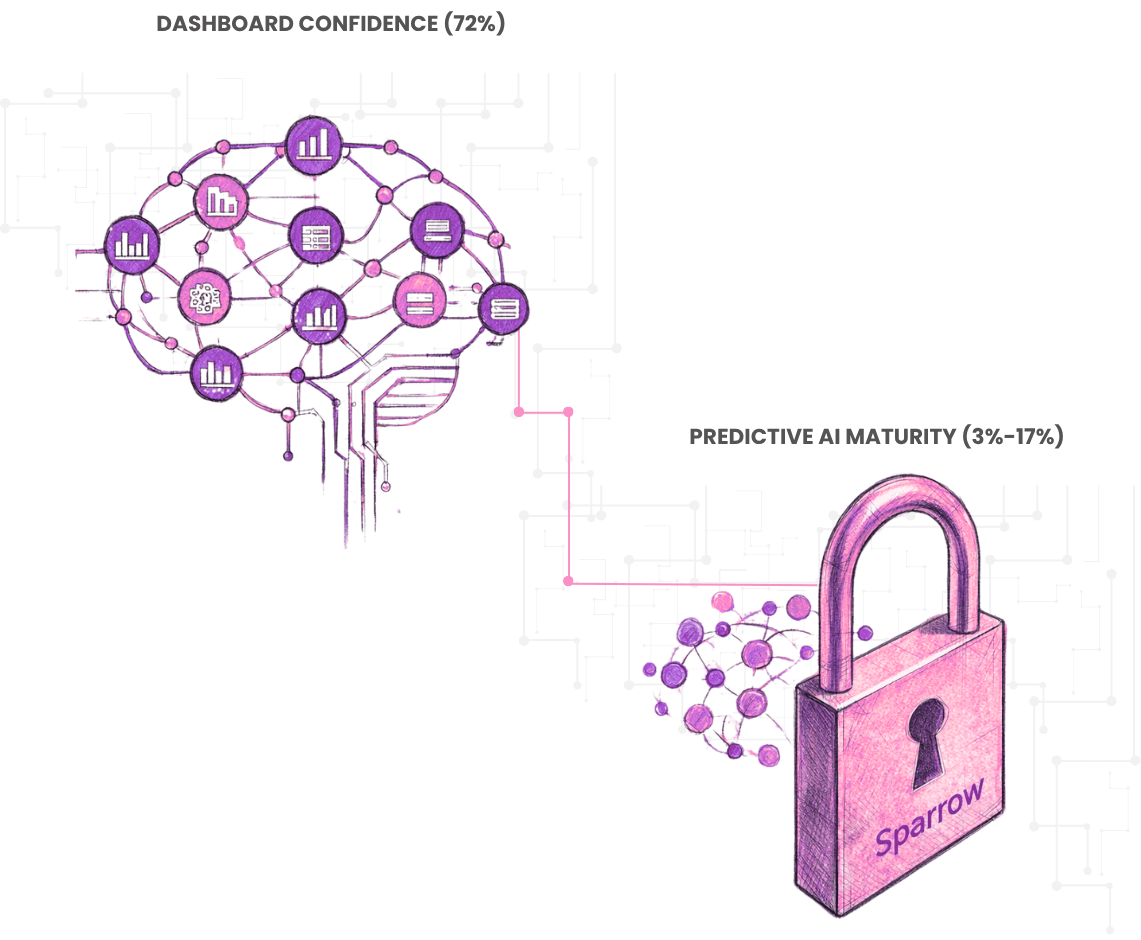
We asked all three levels whether AI or predictive analytics tools are in active, at-scale use for risk management. Active use sits at just 14% among Senior leaders, 3% among Middle managers and 17% among Entry-level staff.
Predictive AI maturity sits between 3% and 17% at every level - against 72% dashboard confidence at Middle.
What the data suggests
This is not a problem of perception; it is a genuine maturity gap. Every level, from the executive suite to the frontline, is looking at much the same immature starting line. That consistency is, in an odd way, useful: no layer has raced ahead and none is holding the rest back, so the whole organisation can move forward from the same point together.
Barriers to AI and digital adoption
We asked what is holding back further AI and digital investment. Budget constraints came out https://sparrowrms.in/sparrow-rms/wp-content/uploads/2026/08/1EHS-1.webp top for both groups - 53% for Senior leaders and 55% for Middle managers - ahead of data quality and skills gaps.
Senior leaders
name budget as the top barrier
Middle managers
name budget as the top barrier, ahead of data quality and skills gaps
What the data suggests
Digital transformation in EHS is not being blocked by any lack of belief in the technology. It is, at heart, a question of capital allocation - the same question at every level.
That is an easier problem to solve than a cultural one: it does not require winning an argument about whether the tools are worthwhile, only deciding to fund them.
Chapter six
Environment and ESG
One finding, and one open question that should be settled before this chapter travels further. As the numbers stand, ESG effort is being pulled by brand image at the top and by regulatory compliance in the middle - not by the investor and board pressure many narratives assume.
ESG drivers by role
Senior leaders are driven mainly by brand image (67%), with investor pressure their lowest-ranked driver (17%). Middle managers are driven mainly by regulatory compliance (58%), with ‘board conviction’ their lowest (11%). This runs counter to the common industry assumption that investor and board pressure are the primary forces behind ESG effort.
Senior leaders
Middle managers
What the data suggests
As the data stands, brand image and regulatory compliance emerge as the primary drivers of ESG efforts, while investor and board pressure appear to have a comparatively limited influence.
From findings to a self-audit
Implications and readiness checklist
The findings in this report describe the industry. The checklist below turns them on your own organisation. Each statement is something the survey suggests a well-run EHS function should be able to say about itself today, and each maps to the finding that motivates it. Work through it honestly with your leadership team: tick what is true in practice, not what is true on paper.
{{ bandTitle }}
{{ bandBody }}
Culture and the frontline
Systems and operational discipline
Investment and digital
Talent and ESG
12 or more ticks
Ahead of most of this survey. The remaining unticked items are your entire improvement agenda - few enough to name individually in your next leadership review.
7 to 11 ticks
Where most surveyed organisations land. The pattern of gaps matters more than the count: if they cluster in Culture and the frontline, you are looking at the gradient problem - and the cheapest fixes need visibility, not budget.
6 or fewer ticks
Money, systems and leading indicators are already normal across the industry, so the raw material for every unticked item most likely already exists. Start with the three reporting and recognition items.
Whatever the score, the test worth repeating is the one this report keeps returning to: ask the same question at the top of the organisation and at the frontline, and measure the distance between the answers. When the two answers converge, the checklist above will tick itself.
Method and reading notes
About this research
The findings in this report come from the Sparrow RMS EHS Research Survey, 2025–26 cycle, which gathered data from 1,000+ respondents across three distinct organisational tiers:
Senior leaders
CXOs, VPs, Directors and Heads of EHS.
Middle managers
Managers, Deputy Section Managers and Supply Chain Leads.
Entry level
Supervisors, Officers and Frontline Workers.
Questions spanned six domains: career & talent, safety culture, budget and investment, process safety and operational discipline, digital transformation and AI, and ESG. Nineteen findings met the bar for inclusion.
Reading the PICs
Percentages describe the share of the named cohort giving the response in question; scores are averages on the scale noted in the PIC. Where items measured on different scale lengths (e.g. 1–3 and 1–10 ( in pdf) Download Full PDF ) are presented together in normalised percentage terms, raw average scores are rescaled as a proportion of the scale maximum to maintain direct comparability across metrics. Where a PIC shows a segment-level split, the split is presented so as to be consistent with the headline figures reported from the survey; the headline figures take precedence and are the numbers quoted in the text. PIC. 19 is a case where the finding runs against common assumptions about what drives ESG effort - a reminder that this report follows what the data shows rather than the prevailing narrative.
On paired questions and gaps
Several findings deliberately ask different levels about the same reality - for example what managers believe workers would do against what workers say they would do, or how visible leaders rate themselves against how visible the frontline experiences them to be. Where this report speaks of gaps, it is comparing those paired questions, not judging any cohort’s honesty. Perception gaps of this kind are treated as findings in their own right, because in safety culture the perception held at the frontline is the operative fact.
