Digital P&ID: Future of Process Safety & Engineering Information

Add Your Heading Text Here

In process industries, data is critical for making any informed decision such as optimizing processes, improving product quality, reducing costs, and implementing safety. However, one of the biggest challenges that process industries face today is the lack of data or the inconsistency of data.

P&IDs: Importan

Used for:​

a. Management of change (MOC) 
b. PSM Studies
c. Risk Mgmt & Mitigation

By:
a. Process engineers
b. Designers
c. Operators
d. Maintenance
e. Safety personnel
© Sparrow Risk Management Pvt. Ltd.

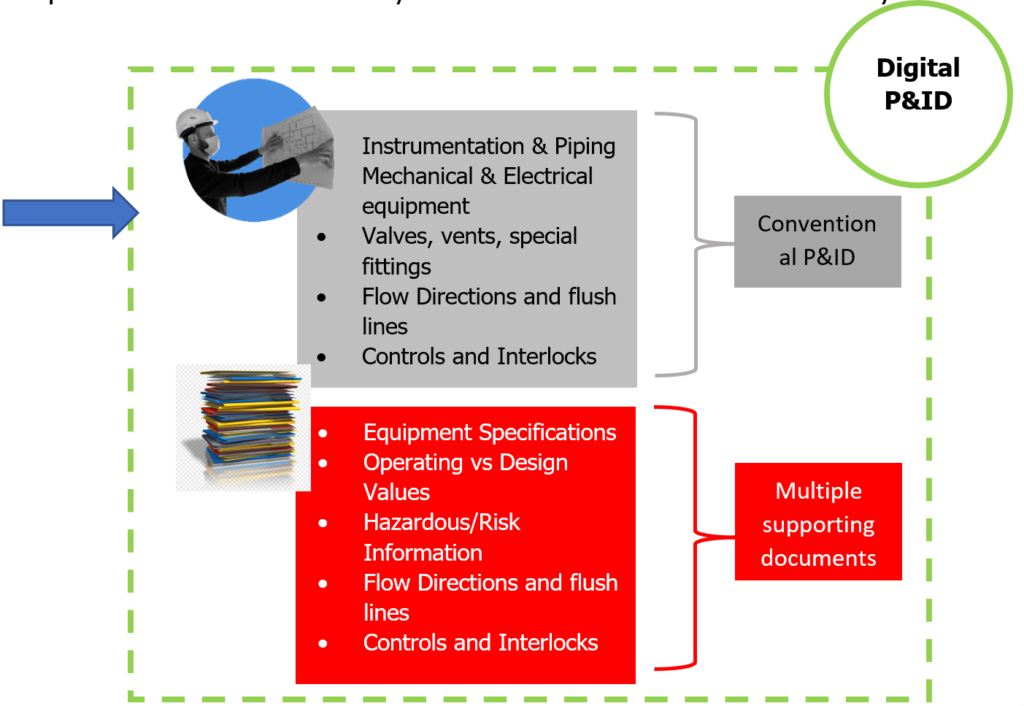
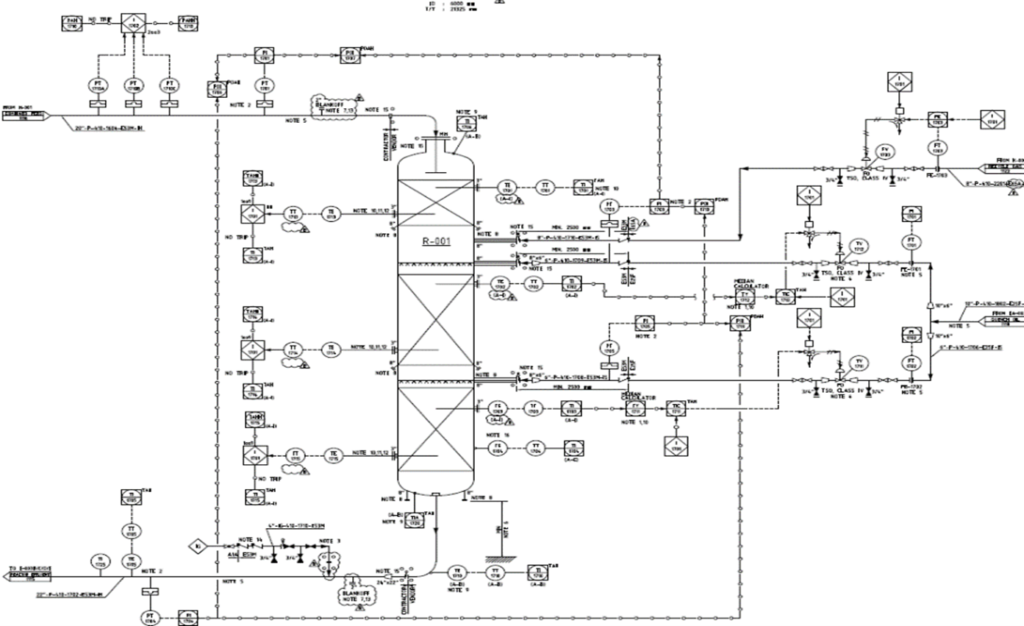
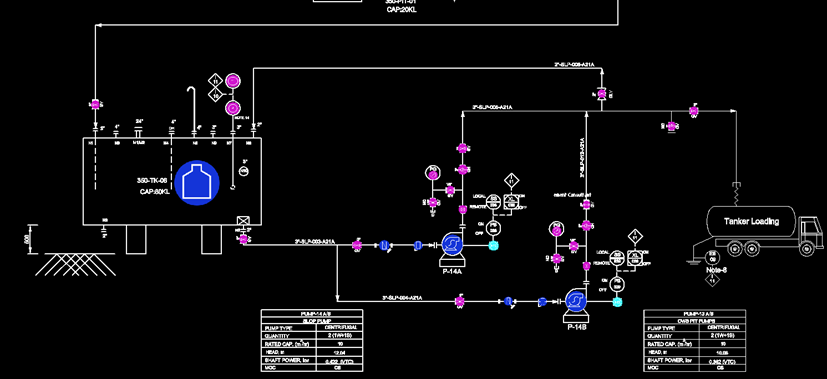
Conventional P&ID have not evolved over the period of years and retain their legacy approach towards focussing on only conveying the process flow, key components (equipment and instrumentation) and detailing of I/O.

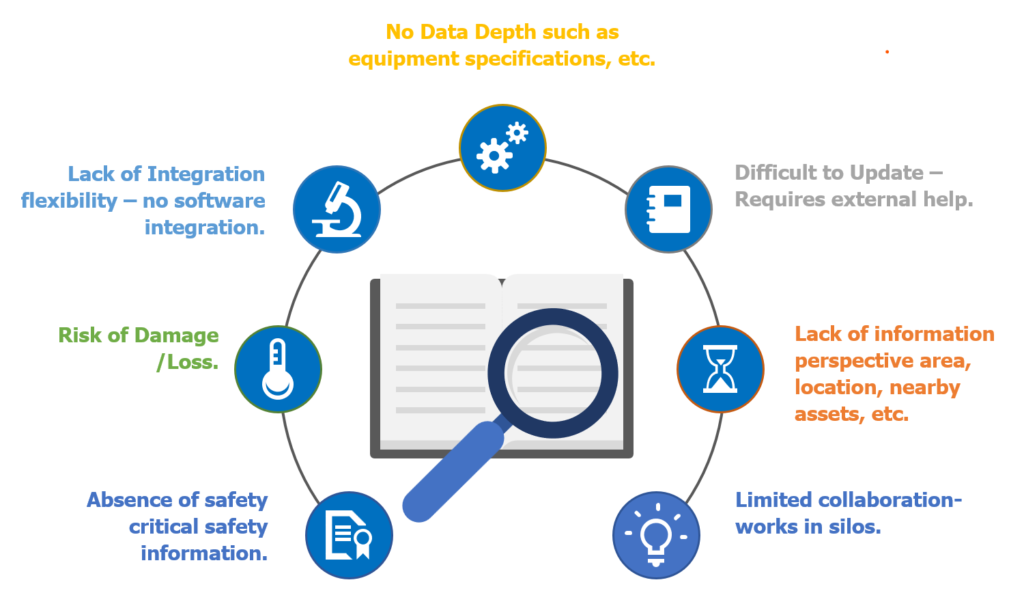
Limitations of Conventional P&IDs:
Digital P&ID has all the elements of a conventional P&ID backed by a layer of data with software integration.
© Sparrow Risk Management Pvt. Ltd.

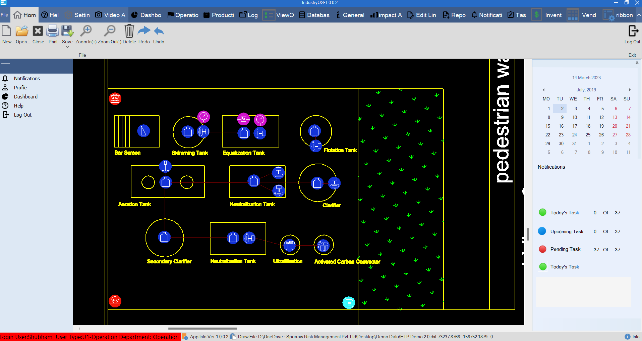
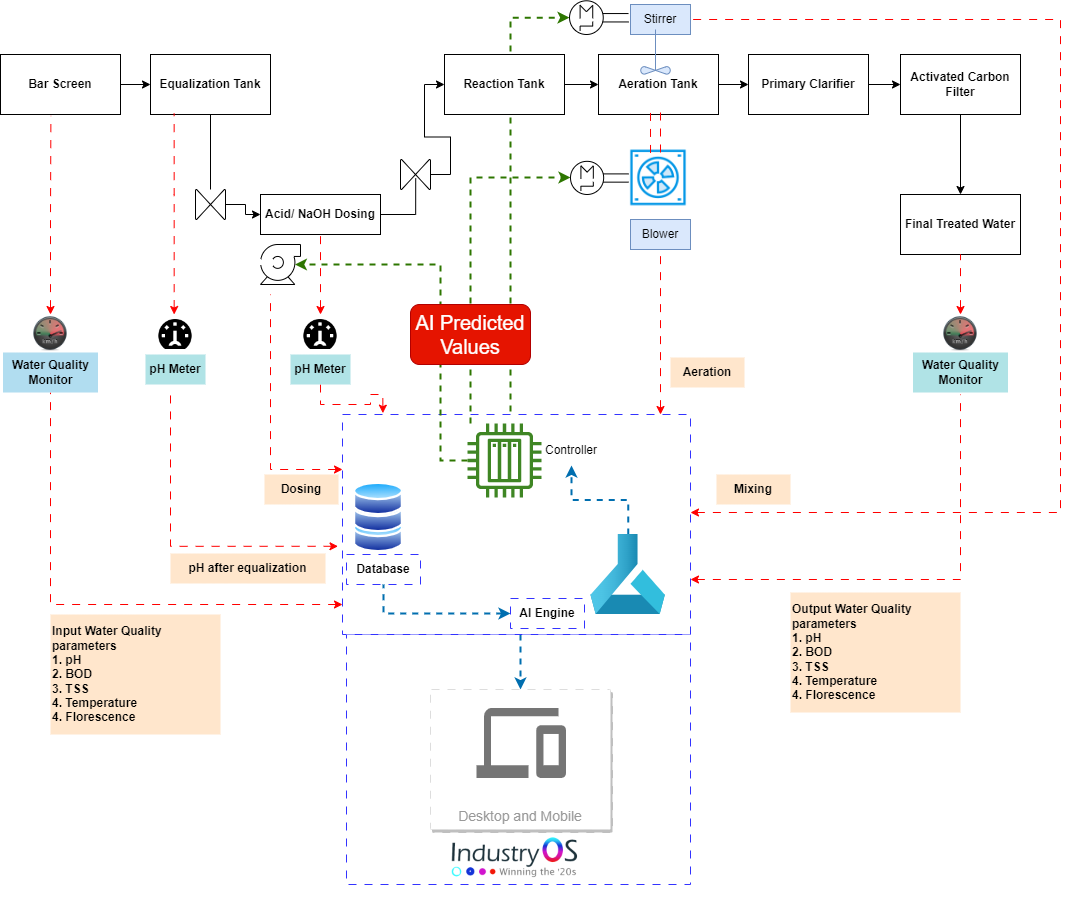
Digital P&ID, based on the concept of iLOL™ (Information Layered over Layout) creates an exact replica of the process on the overview of the plot plan of the site through Digital Twinning. It has all the elements of a conventional P&ID backed by a layer of data.

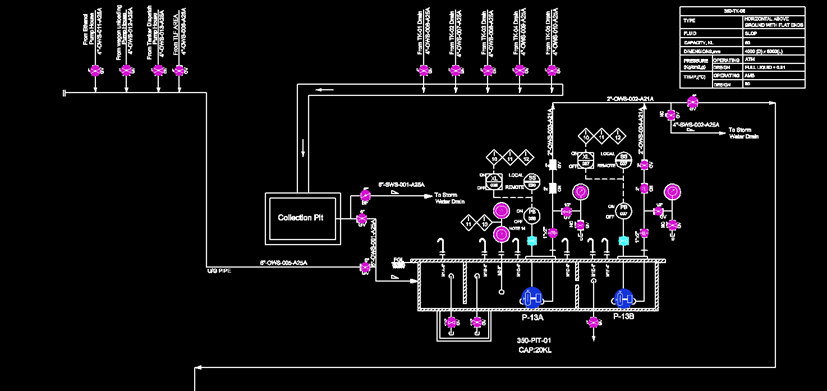
Digital Twinning through iLOL™:

iLOL™ - Information Layered Over Layout.

iLOL™ is a 2D Digital Twin Technology innovated by Sparrow to represent your premises in digital environment, exactly the way you see your plant/factory – which then uses layers of information creating a data lake of all machine and process information.

The information data covers all possible elements:

  • Machines
  • Connections
  •  Equipment Specifications
  • Process
  • Specific Maintenance & operation data

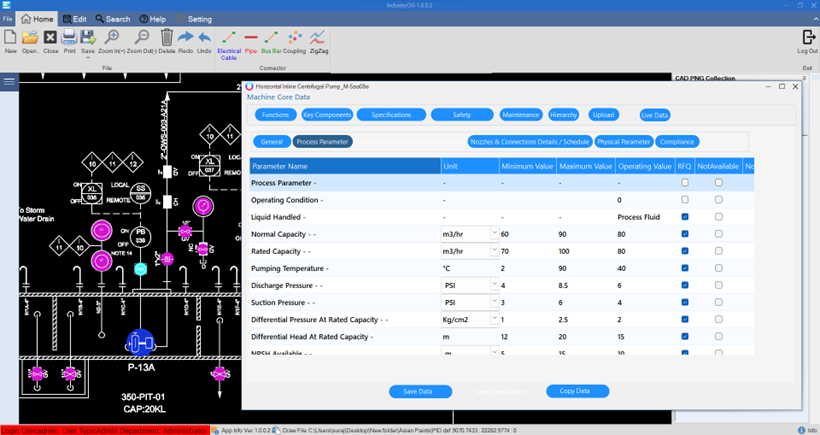
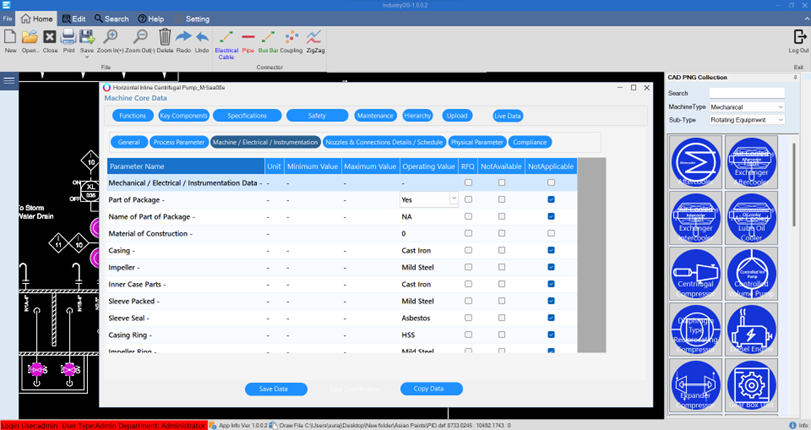
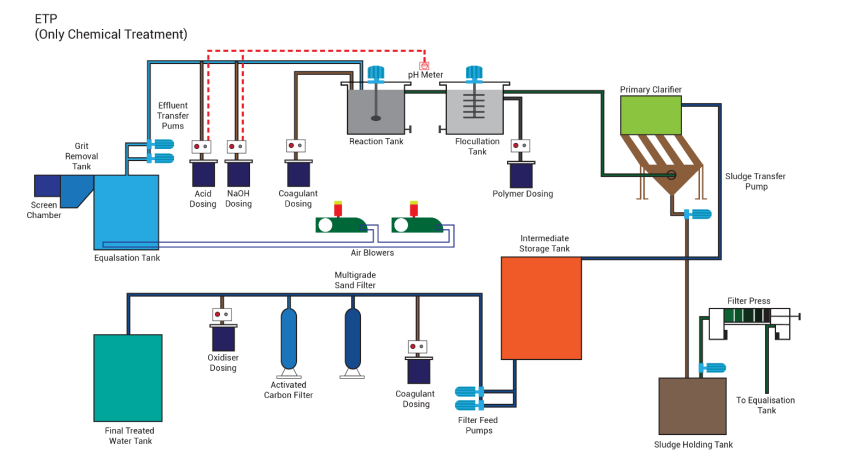
Each icon is an equipment that is modelled as an ANSI database. The equipment can be dragged and dropped, and connections can be created at ease with every connection type such as piping, electrical or mechanical.

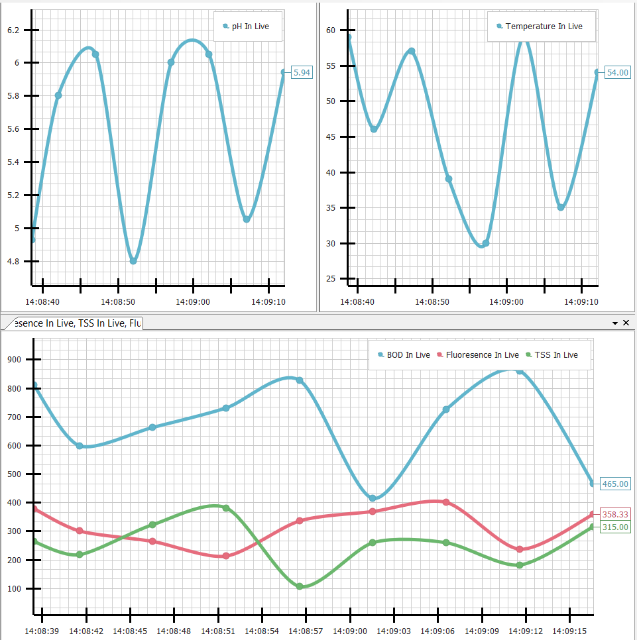
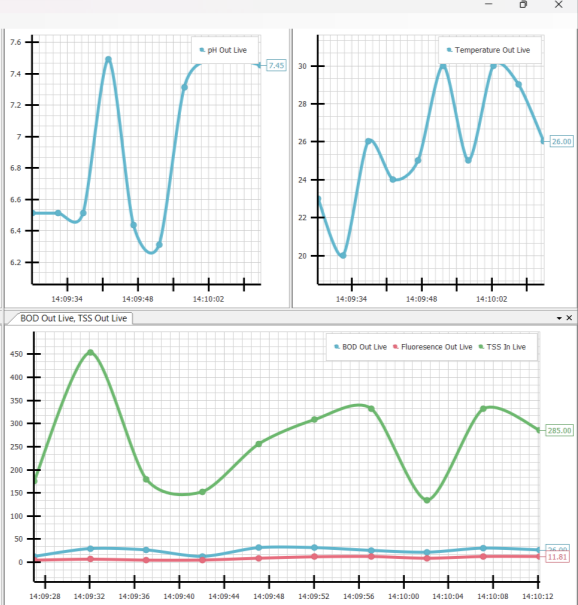
The data depth is detailed and exhaustive to include:

  • Detailed design specifications.
  • Max and Min operating values.
  • Instrumentation
  • Safety Components
  • Process Hazards
  • Risk Assessment Scenarios
With a library of over 5200+ assets of different classes, IndustryOS™ can build any P&ID across various industry segment and most complex processes.
Benefits of Digital P&I:
Visual Connect

Exact equipment location (area wise) (adjusted to one elevation level)

Increased Safety

Data depth enables risk assessments such as HAZOP, LOPA, etc.

Enhanced Collaboration

Update and share easily, ensuring up-to-date info.

One Version of Data

Process & major parameter of equipment and instruments in a single click.

Seamless Integration

Integrate with other software tools.

PSM Foundation

Data foundation layer for – Risk Assessment, MOC, PHA, etc.

Process Safety Information

© Sparrow Risk Management Pvt. Ltd.
ETP

Optimization of Effluent Treatment Plants (ETP) through IndustryOS™

ETP Introduction

ETP- Effluent Treatment Plant  is a wastewater treatment system that is designed to remove contaminants from industrial effluent or sewage water. ETPs are commonly used in industries such as chemical manufacturing, pharmaceuticals, and textiles, where large quantities of wastewater containing toxic chemicals and pollutants are generated. ETP operations is plagued by various problems which force the major companies to outsource the operation and maintenance of the same to carious sub-vendors.

Major Problems:

Exceeding Prescribed Limits

Huge Maintenance & Operational Costs

High Energy Consumption

Fragmentation of Operation

Staffing & Manpower

Sustainability & Waste

Solution:
ETP Digitalization Case Study
Feasibility Study and Upgradation:

➢ Study of the current process and the
operational bottlenecks.
➢ Review of the plant perspective hardware and
sensor capabilities.
➢ Installation of IoT Sensors.

Establishing Automated Continuous Monitoring

➢ Creation of Digital Twin.
➢ Mapping of static and workflow data.
➢ Real-time data acquisition through IoT
Sensor.
➢ DCS/SCADA Integration through OPC.

Alerts and Notifications

➢ Defining boundary parameters as per local
and national regulatory guidelines.
➢ Automating

Data Analysis and Relational Diagnosis

➢ Establish co-corelation between various
input, process, and output parameters.
➢ Define Principal Component

Advanced MIS

➢ Root cause analysis for quality deviations
➢ Analytical insights of each section

Optimization though AI/ML

➢ Model Development and AI training for
predictive model
➢ Automation of input via AI predicted values to
create error free operation.

etp only chemical treatment
Overview of typical ETP Process
Digital Transformation Journey -IndustryOS™

IndustryOS™, a first of its kind software, enabling industries to innovate their path in providing
real-time visibility into production processes, allowing companies to quickly identify
bottlenecks and optimize operations.

Through IndustryOS™ Module, we are providing an integrated module to monitor and manage
the entire ETP operations and maintenance. Three sets of data are integrated to deliver a
functioning module with intelligent logical workflows.

ETP Digitalization Case Study
Static Information
Entire Process and equipment mapped as a digital
layout capturing the static data such as design
parameters, equipment specifications, process
Workflow Information
Digitalization of equipment monitoring log sheets with
custom dashboard, notification, and alerts
Static Information
Capture process parameters being monitored through
DCS such as temperature, pressure, flow rates, etc. and
integration to digital twin model for real-time
monitoring.

Case Study:

Problem Statement:
A major automobile manufacturer was struggling with ETP operation optimization.
The following major issues were being faced by them:

1. High Maintenance: The setup was a legacy system with PLC and automation which were either non-operational or bypassed.
2. Cost Implications: The entire operation the ETP facility was outsources to a 3rd party vendor which managed the process manually. This had significant cost as well as
quality implications.
3. Quality Issues: The facility failed often to adhere to the government norms which had cost and status implications.

Process Involved:
• Grit Removal

• Equalization

• Acid Dosing

• Aeration

• Reaction

• Flocculation

• Coagulant & Polymer Dosing

• Mixing

• Filtration
Architecture of Implementation
1. Capturing Real-time effluent quality parameters at each stage

The primary objective of an ETP to treat the wastewater to a level so that it can be safely
discharged into the environment or reused.

We enabled capturing of critical parameters (both
chemical and biological) on real-time to monitor the effectiveness of the treatment process through IoT enabled sensor integration.

Example: pH, Turbidity, TSS, BOD, COD, etc.

2. Monitoring of critical treatment parameters

With extensive process know-how, we determined the parameters that need to be monitored and the data points that need to be gathered to derive the input values.

The exact determination of the input parameters helps ensure that the optimum operational conditions with respect to the SOP is being adhered to. Any deviations could lead to quality issues and render the process futile.

3. Live Equipment Performance

The effectiveness of the treatment process depends greatly on the designed performance of the machines/ equipment involved in the process such as dosing pump, air blowers, stirrer, etc.Through DCS/SCADA integration, we capture the continuous performance of the machines against designated set-points. 

Any performance anomaly affects the operating conditions of the process leading to deviations of inputs which will in-turn generate adverse effects on the output water quality.

4. Alerts and Notifications

Generation of alerts and notifications for all monitored parameters such as Output water quality, input treatment parameter and equipment performance keep the operators and related stake holders notified of any major disturbance enabling prompt remedial actions.

5. Time-series Data Analysis and Relational Diagnosis (Causal Relationship)

Continuous acquisition of time-series data and analytics helps establish a causal relationship to identify the factor that led to the quality disturbance. This helps to identify the root-cause of the issue in no time enabling swift and targeted action plan.

➢ Identification of area of release with greatest pollutants.
➢ Identification of process/activity that led to deteriorated effluent.
➢ Impact of any adverse event on the effluent quality.

6. Analytics and MIS

Advanced and custom plant level and Management MIS pulls relevant information with status, tracker, alerts, and deviation logs, etc giving the management a holistic view of the targets. Analytics helps identify the Lag KPI’s and define the Lead KPI’s.

7. Optimization through AI/ML

IndustryOS™ leveraged the power of AI & ML to establish co-relation using advanced regression models between the quality parameters of the
incoming polluted water, the required level of
quality as per permissible limits and the
operating parameters that are needed to achieve
those criteria. Thus, from a conventional setpoint based operating procedure, we were able
to scale to predictive operations.
We were able to predict:
➢ the quantity of dosing
➢ the amount of aeration required, and
➢ the mount of mixing needed.

Results: Problem Statement:

Result:

Why Partner with Sparrow for Your Digital Acceleration?

As you begin your digital acceleration journey, you will need to partner with a company that can provide both business and technical advice and ensure that your strategic roadmap for digital acceleration will be successfully implemented. After helping you create the complete digital acceleration roadmap, Sparrow will continue to help implement the processes needed to transform work, streamline the work processes, and reduce the wasted work. We use a holistic approach that integrates both horizontally and vertically within your organization, making us best suited for this initiative.

Sparrow is trusted by global industry leaders as the leader in digital transformation of process manufacturing companies. As we connect people with processes and technology, we deliver comprehensive Value Chain solutions for the process industries. We work with a global partner network that is focused on the complete digital acceleration journey.

Our Differentiators

300+ clients
1100+ Projects
300+ Countries
300+ # Teams

• We gross highest revenue in our domain
• We master Safety, Risk, Engineering &
   Technology
• We integrated Risk to Engineering (first
   one to do this)
• Now integrating highest end technology to
    EHS & Engineering

Sparrow is uniquely focused on digital transformation in plant engineering, procurement, construction, and operation, and we are trusted by the world’s leading integrated, national, and independent chemical corporations to act as your digital transformation partner.

Note: Please raise any query in the form to the concerned team of Sparrow Risk Management. Or, you can always reach our central team at rms@sparrowrms.in

Information control: Our Data is managed as per the guidelines of ISO 27001, European Union (EU) Model Clauses, the Health Insurance Portability and Accountability Act Business Associate Agreement and the Federal Information Security Management Act (FISMA) as in by Microsoft (onedrive).

Website: www.sparrowrms.in

Central Contact: +91 88000 98404

Central Sales Contact: rms@sparrowrms.in

1EHS Insights Report 2021 (Click here to download the full report)

This year’s 1EHS Insight Report (edition II) is deeper and more data driven, it mesmerizes your thoughts on endless possibilities of growth in EHS. It focuses on future trends, perception & possibilities in EHS perspective Personal Career & Growth, Sustainability, Role of technology, Process Safety, Road Safety to name a few. We have also updated the data nodes for career orientation & related educational institution demand along with global certification indexes.

Click here to download the full report.